CLOSE
Specials
- RegTech Europe
- Financial Risk Management APAC
- Investment Banking APAC
- Corporate Advisory APAC
- Regtech APAC
- Escrow Services
- Digital Banking Latam
- Trading Solutions APAC
- Treasury Management Europe
- CPA Firms Canada
- Financial Risk Management Europe
- Mortgage Broker
- Financial Licensing Europe
- RIA Advisory Europe
- FinTech Canada
- Financial Asset Management APAC
- Investment Banking Canada
- Payment Solution
- Lending Mangment Latam
- Payment Solution Europe
- Broker Dealer Firms Canada
- Alternative Investments Canada
- Financial Fraud
- Investment Management Latam
- Financial Health Europe
- Lending mangment
- Financial Marketing
- Proprietary Trading Europe
- Wealth Management
- FinTech
- Financial Brokerage Firm APAC
- Investment Advisory Europe
- Investment Advisory APAC
- Wealth Management MENA
- Claim Adjusting
- Claim Adjusting APAC
- Mergers and Acquisitions Consulting APAC
- Equipment Financing
- CPA Firms
- Mergers and Acquisitions Consulting Canada
- Investment Services
- Valuation Services Canada
- Wealth Management APAC
- Broker Dealer Firms
- Debt Collection Agencies
- Mergers and Acquisitions Consulting
- FinTech Europe
- Fintech Latam
- Financial Planning / Retirement
- Investment Management
- Financial Compliance
- Digital Banking Europe
- CFO Services
- Debt Collection Agencies Europe
- Wealth Management Europe
- Mergers and Acquisitions Consulting Europe
- Financial Restructuring Europe
- Financial Portfolio Management Canada
- Business Loan
- Payment and Card Latam
- Wealth Management Latam
- Mergers and Acquisitions Consulting Latam
- Tax Advisory Canada
- Trading Solutions Europe
- Alternative Investments
- Digital Insurance Europe
- Investment Services Latam
Weekly Brief
×Be first to read the latest tech news, Industry Leader's Insights, and CIO interviews of medium and large enterprises exclusively from Financial Services Review
Thank you for Subscribing to Financial Services Review Weekly Brief
Stock Charting Software-How it Helps Traders
Apps for stock analysis, stock research instruments, and even stock forecasting software are all employed for the same thing.

By
Financial Services Review | Monday, April 10, 2023
Stay ahead of the industry with exclusive feature stories on the top companies, expert insights and the latest news delivered straight to your inbox. Subscribe today.
Trading in the stock market requires access to the right tools and software to make informed decisions. Stock charting software, technical analysis, trading platforms, trading analysis software, trading software for stocks, software for trading, automated trading systems, and online stock trading are essential for successful trading.
FREMONT, CA: Apps for stock analysis, stock research instruments, and even stock forecasting software are all employed for the same thing. These trading tools are available to help day traders and investors locate the best stocks by streamlining the stock analysing process. These can be stock research tools with extensive data capabilities for fundamental data analysis or technical analysis tools for visual trade evaluation via charts.
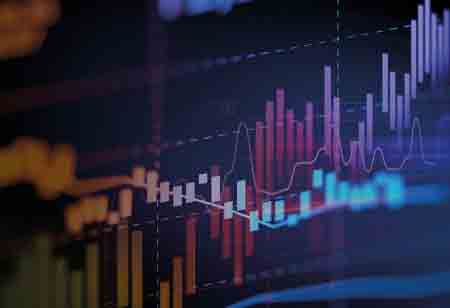
For traders who want to examine price trends and identify market movements, stock charting software is a crucial instrument. By employing charts and other visual aids, traders can evaluate price data and analyse trends. Stock charting software generally has the following features:
• Real-time data: By providing traders with the most up-to-date information, stock charting software provides real-time data.
• Charting tools: The diverse charting capabilities offered by stock charting software allow traders to view data in a variety of formats, including line charts, bar charts, and candlestick charts. These tools aid traders in spotting market trends and patterns.
• Technical indicators: A variety of technical indicators, including moving averages, the relative strength index (RSI), and Bollinger Bands, are also offered by the majority of stock charting software. Stock charting software's indicators can assist traders in locating potential entry and exit locations for trading.
Further, the two main types of stock charting software are:
Web-based software: With web-based software, traders can access it from any internet-connected device.
Desktop-based software The desktop-based software installed on a trader's computer provides faster performance, more features, and a higher level of technical expertise.
Charting tools, technical indicators, and ease of use are all important factors to consider when selecting stock charting software.
Technical analysis is a trading strategy that uses market patterns and historical price movement analysis to forecast future price movements. It is a crucial tool for traders who wish to make well-informed trading decisions, and stock charting software is frequently used in combination with it. Basic technical analysis principles include the following:
• Trend identification: Technical analysis is used to spot market trends like uptrends, downtrends, and sideways movements. Traders can spot trends using technical indicators and charting tools.
• Support and resistance: To pinpoint crucial market support and resistance levels, technical analysis is often performed. These values show the range in which prices are most likely to increase or decrease.
• Momentum: The momentum of price changes is another factor that technical analysis looks at. To determine if prices are overbought or oversold, traders can utilise technical indicators like the Moving Average Convergence Divergence (MACD) and Relative Strength Index (RSI).
Software for stock charts is a crucial resource for technical analysis. Stock charting software can be used by traders to:
• Identify trends: Moving averages, trendlines, and chart patterns are just a few of the charting tools that traders have access to through stock charting software to help them spot market trends.
• Analyse indicators: Technical indicators offered by stock charting software can be used to assess price changes and pinpoint possible entry and exit locations for trades.
• Backtest strategies: Traders can backtest their trading techniques using stock charting software, allowing them to examine how well they would have fared under previous market situations.
Moving averages, Bollinger Bands, the Relative Strength Index (RSI), and the Stochastic Oscillator are examples of popular technical analysis indicators that can be utilised with stock charting software. Overall, stock charting software and technical analysis are crucial tools for traders who want to make wise trading choices. Trading opportunities can be found by using stock charting software to examine the market and spot trends, support and resistance levels, and momentum.
Algorithmic trading, commonly referred to as "algo-trading," or automated trading systems, are computer programmes that automatically carry out trades in accordance with predetermined rules and criteria. Without requiring human input, these computers can detect possible trading opportunities and carry out trades using sophisticated mathematical algorithms and technical analysis. Benefits of utilising automated trading systems include:
• Speed: Trading opportunities that may present themselves on the market in a matter of seconds or milliseconds can be taken advantage of by traders using automated trading systems, which can execute deals far faster than human traders.
• Objectivity: Automatic trading systems would make unbiased decisions based on predetermined rules and criteria without being swayed by emotions or prejudices.
• Backtesting: By analysing previous market data to backtest automated trading systems, traders can assess the effectiveness of their trading tactics and make any necessary improvements.
• Efficiency: In order to execute trades in various marketplaces and take advantage of more possibilities, automated trading systems can simultaneously monitor several instruments and markets.
Software for stock charts and technical analysis is necessary for successful stock market trading. Stock charting software offers a variety of visual tools and capabilities to assist traders in analysing and interpreting market movements, while technical analysis enables traders to make informed judgements based on market data and past price patterns. Technical analysis and stock charting software can be used together by traders to better comprehend the market and forecast future price movements. However, it's crucial to keep in mind that these instruments should be utilised in conjunction with trading expertise and experience, as well as a thorough knowledge of market fundamentals. By using technical analysis and stock charting tools, traders have a better chance of making good trades and reaching their investment objectives on the stock market.

Copyright © 2025 Financial Services Review. All rights reserved


